Difference between revisions of "Data Loggers"
| (One intermediate revision by the same user not shown) | |||
| Line 165: | Line 165: | ||
The ok file contains a copy of all records that have been successfully processed, while the err file will contain all records that were discarded due to format errors or other error conditions. If no errors are detected, only the ok file is created during the import process. | The ok file contains a copy of all records that have been successfully processed, while the err file will contain all records that were discarded due to format errors or other error conditions. If no errors are detected, only the ok file is created during the import process. | ||
| − | Use the following event action to upload a CSV file to insert, update or delete records of a data logger. The file, named | + | Use the following event action to upload a CSV file to insert, update or delete records of a data logger. The file, named <data logger id>.csv, is read from the < path> directory: |
DATALOGGER name = FILE CSVREAD path | DATALOGGER name = FILE CSVREAD path | ||
Latest revision as of 13:11, 13 February 2017
Data loggers allow to gather, process and visualize statistical data on the variations of a data set.
They can be used to automatically generate periodic charts of its trend and/or to log data as CSV files.
Data loggers collect data and group them in order to visualize the trends in charts for each hour (or group of hours) of the current and past day, each day of the current and past month, and each month of the current and past year. It is also possible to have an higher resolution of a single minute, but this implies a notably higher disk space usage.
Further, they allows for the logging of every processed value.
There are two types of data logger:
- counter: suitable for the creation of statistics of an incremental value (e.g. energy consumption or production). It calculates the variation (delta) of the value for each time interval with respect to the previous one. Further, it is possible to specify time slots and the relative rates to calculate for instance the costs for energy consumption.
- range: aimed at the computation of the maximum, minimum, and average of a fluctuating value (e.g. a measured temperature or humidity) for each time interval.
Once a data logger is defined in HSYCO's Settings, you can easily pass data to it using a simple action in EVENTS, a JavaScript function or Java method, and display statistical data using the Datalogger UI object.
Contents
Counter Data Loggers
The first step to create a counter data logger is to define it in the HSYCO configuration.
Refer to the Data Loggers section in the configuration chapter for a complete description of all the available parameters and options.
In the following examples we have defined a counter data logger named “energy” with default parameters.
Now, we need to provide the data logger with the incremental value we want to process.
Assuming we have an I/O datapoint named “elektro.kwh” which provides the energy consumption value, we write the following lines in EVENTS:
IO elektro.kwh : DATALOGGER energy = IO elektro.kwh, DATALOGGER energy = FILE LOG energy.csv
Whenever the I/O datapoint will provide a new value, the data logger will be updated and a log entry will be added to the file “energy.csv”.
Finally, in order to display the data logger’s charts, we should use the Datalogger object and set its ID to "energy"
For a complete reference of all the available actions on data loggers refer to the relative section in the Events programming chapter.
The same actions can be performed using JavaScript or Java code.
We could also create a data logger to monitor the expenses relative to energy consumption, initializing a new counter data logger and declaring the time slot rates in the file dataloggers.ini located in HSYCO's root folder.
We add a new data logger with ID "cost" in Settings, then, we set the "elektro.kwh" I/O datapoint to update the data logger. In EVENTS we add this line:
IO elektro.kwh OR TIME : DATALOGGER cost = IO elektro.kwh
Note that this time we are updating the data logger not only when a new value is available, but also every minute. This is necessary to have an accurate calculation of the expenses.
Now we need to declare our time slots in the file dataloggers.ini, for instance:
cost; 0; 00:00-11:59; *; *; 0.3
cost; 1; 12:00-16:59; *; *; 1.4
cost; 2; 17:00-23:59; *; *; 0.8
These rules state that every day from midnight to 11:59:59 we are in slot 0 and the rate to be applied is 0.3, from 12:00:00 until 16:59:59 we are in slot 1 and the applicable rate is 1.4, later on slot 2 applies with a rate of 0.8.
We can include some exceptions by adding some lines before these rules:
cost; 0; *; *; 2000/12/10-2000/12/31; 0.3
cost; 2; *; 67; *; 0.8
cost; 0; 00:00-11:59; *; *; 0.3
cost; 1; 12:00-16:59; *; *; 1.4
cost; 2; 17:00-23:59; *; *; 0.8
The previous rules will still apply, except on Saturdays (6) and Sundays (7) when during all day slot 2 will apply.
Further, during the period between December 10th and December 31st of 2000, slot 0 will always apply despite the day of the week or the time.
Refer to the section about the dataloggers.ini file for a complete reference on how to write time slots rules.
At this point we should add the Datalogger object to the user interface to display the charts. The user interface also allows you to filter data by rate.
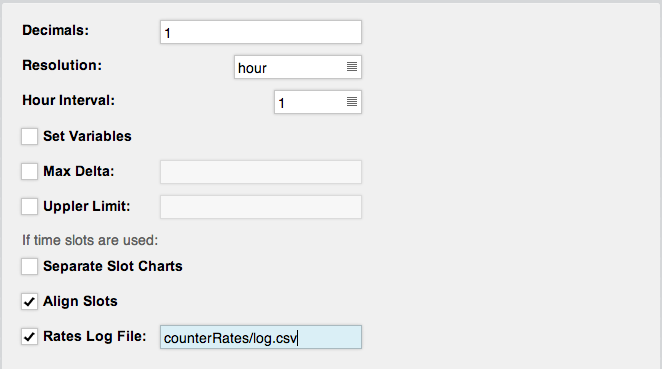
Further, we can have a detailed report of all the processed data by specifying the path of a log file using the "Rates Log File" option in the data logger's settings:
This will create a CSV file listing a row for each update of the data logger divided in the following columns:
data_logger_name, update_time, provided_value, calculated_cost, slot_id, applied_rate
Range Data Loggers
In the following examples we define a range data logger, named “temperature”, with default parameters.
We set the data logger to follow the temperature measured by a probe identified by the I/O datapoint “termo.temp”.
We specify in events that every minute it must be updated, plus we log the measured value in the file “temp.csv”:
TIME : DATALOGGER temperature = IO termo.temp, DATALOGGER temperature = FILE LOG temp.csv
The created charts will automatically be scaled to range from the lowest measured value to the highest and charts belonging to the same period will be aligned.
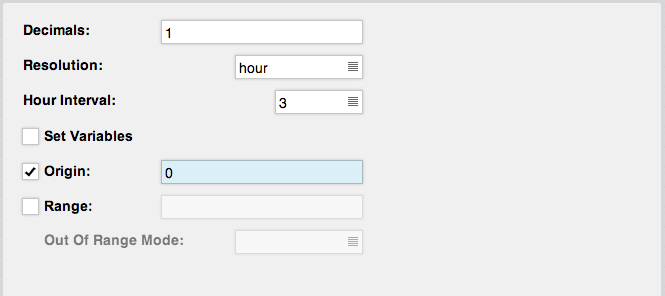
By default, the origin of the charts is set to correspond to the lowest measured value.
One might prefer to set the origin to a specified value (for instance zero) so to highlight the difference between values below and above it.
We can achieve this by setting the Origin option in the data logger settings:
Finally, in order to display the data logger’s charts, we should add the Datalogger object to our interface.
CSV Import/Export
Using the HSYCO's development API, in Events, JavaScript and Java, you can export a full dump of all data underlying each data logger.
The CSV file uses \r\n as line separator and ';' as field separator.
This is an example of the CSV file for a counter data logger.
ts;delta;cost;locked
20160129130000;2.0830569986031082;0.0;1
20160129140000;3.464736775902562;0.0;1
20160129150000;0.04146936782360733;0.0;1
20160220120100;0.005090918751661816;0.0;0
20160220120200;0.039745587753242655;0.0;0
The record format has the following four fields:
- ts: the timestamp as YYYYMMDDhhmmss
- delta: a double precision floating point of the accumulated values for the period between this record's timestamp and the next
- cost: a double precision floating point of the cost value for the period
- locked: a boolean, represented as 1 for locked records, and 0 for unlocked records. A record is marked as locked when its cost value is permanently set, and will not change if the rates rules are changed in the future.
This is an example of the CSV file for a range data logger.
ts;vmin;vmax;vavg;vcount
20170114150100;3.607471109385042;4.694435324229342;4.241931611566256;15
20170114150200;3.8066206378643987;5.446351986025894;4.575574507553171;16
20170114150300;2.398800160049782;5.2533792997638775;3.6368449963207854;17
20170114150400;1.5474068317929874;3.1531099637853406;2.290833667227986;10
The record format has the following four fields:
- ts: the timestamp as YYYYMMDDhhmmss
- vmin: a double precision floating point for the minimum value logged in the period
- vmax: a double precision floating point for the maximum value logged in the period
- vavg: a double precision floating point for the average value logged in the period
- vcount: a positive integer counter of the number of values logged in the period; this is used to compute a weighted average when new values are passed to the data logger.
Export API
Use the following event action to create a CSV file for a data logger. The file, named <data logger id>.csv is written in the <path> directory:
DATALOGGER name = FILE CSVWRITE path
You can also use the equivalent JavaScript command API:
dataLoggerSave("csvwrite", names, path, timestamp)
And the Java command API (setting action to "csvwrite"):
static boolean dataLoggerSave(String action, String[] names, String path, boolean timestamp)
Import API
Raw data, using the same CSV format of the export APIs, can be imported to a data logger.
You can selectively update existing records, delete records, but also completely wipe existing data and replace them with the data in the CSV file. To delete record, leave just the timestamp value in the CSV file for the records you wan to delete, for example:
ts;vmin;vmax;vavg;vcount
20170114150200;3.8066206378643987;5.446351986025894;4.575574507553171;16
20170114150300
20170114150400
This file will update record with update the values of one record, and delete two records.
Note that the first record in the CSV file is assumed to be the header, and not considered as valid data.
At the end of the import process, one or two files are generated, with the same name of the import file, with the "-ok" and "-err" suffixes to the data logger id, before the .csv extension. The ok file contains a copy of all records that have been successfully processed, while the err file will contain all records that were discarded due to format errors or other error conditions. If no errors are detected, only the ok file is created during the import process.
Use the following event action to upload a CSV file to insert, update or delete records of a data logger. The file, named <data logger id>.csv, is read from the < path> directory:
DATALOGGER name = FILE CSVREAD path
Use the following event action to upload a CSV file that will replace all records of a data logger:
DATALOGGER name = FILE CSVREADOVER path
You can also use the equivalent JavaScript command API:
dataLoggerSave("csvread", names, path, timestamp)
dataLoggerSave("csvreadover", names, path, timestamp)
And the Java command API (setting action to "csvread" or "csvreadover"):
static boolean dataLoggerSave(String action, String[] names, String path, boolean timestamp)

