Difference between revisions of "SSH Tunnel Utility"
| Line 12: | Line 12: | ||
| − | [[File:SSHTunnelUtility1.png|border|600px|center|SSH Tunnel Utility | + | [[File:SSHTunnelUtility1.png|border|600px|center|SSH Tunnel Utility]] |
Revision as of 12:14, 14 October 2020
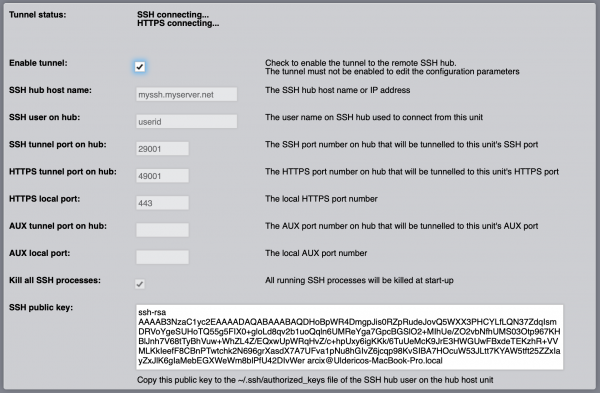
![]() The SSH Tunnel Utility is an application that allows you to easily setup repetitive polling read requests and monitor the performance and status of each request.
The SSH Tunnel Utility is an application that allows you to easily setup repetitive polling read requests and monitor the performance and status of each request.
Each read request is defined with a repeat interval in seconds. The Modbus Utility internal scheduler will try to repeat the execution of each request as close as possible to the preset interval. It will also sequence all requests to the same Modbus I/O server so they never overlap.
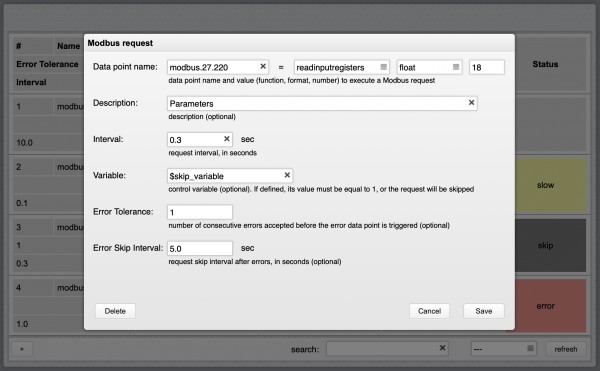
You can optionally assign a variable to each request for conditional execution. If a variable is defined, it has to exist and have value “1” to activate the request polling. Requests that are not active are highlighted in grey.
The optional "Error Tolerance" parameter is used to set the number of consecutive errors accepted before the Modbus error data point is set to report an error condition. The default is zero, so that even a single error will set the error data point. For example, setting the error tolerance to two means that up to two consecutive errors will be tolerated, and only the third consecutive error will set the error data point.
The optional "Error Skip Interval" defines for how long the Modbus Utility should stop executing a Modbus request if an error occurs.
The Modbus Utility tracks the actual repeat interval and compares it with the defined interval. If the difference is more than 25% from the target value, the request is marked as “slow” and highlighted in yellow. The difference between defined and actual interval is reported in the “delta” field.
Requests that return errors are also tracked and highlighted in red.
The minimum and maximum response time is also tracked for each request, and displayed in the “min. time” and “max. time” fields in the requests list.
You can reset the status, delta, minimum and maximum time using the “refresh” button.
You can use filters to only show a subset of requests in the user interface. Entering a text in the search field will only show requests having a data point name that contains the search text. You can also filter by status, selecting slow, skipped, errors, or successful requests.
The Modbus Utility configuration is stored in a human readable file named modbus-scheduler.ini and located in HSYCO’s main directory. If you manually edit this file, it will be automatically reloaded within a few seconds after it is saved. In a high availability setup, the Modbus Utility is also automatically mirrored from the master to the slave server.

