Difference between revisions of "Tutorial7"
| Line 36: | Line 36: | ||
Then add a "text" object with this attributes: | Then add a "text" object with this attributes: | ||
| − | [[File: | + | [[File:Tutorial8-5.png]] |
| + | |||
| + | Here's the final result: | ||
| + | |||
| + | [[File:Tutorial8-6.png|600px]] | ||
Revision as of 17:38, 30 April 2014
This tutorial describes how to create a Datalogger.
To access the Project Editor enter the following URL in your Web Browser:
https://192.168.0.50/hsycoserver/manager
If you need more information about the first login to Hsyco please read first this: Tutorial1
Creating a new Datalogger
Click on the "Settings" icon and then on the "I/O Servers" icon.
Click on the "Datalogger" icon. ![]()
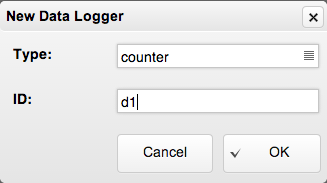
Select the type "counter". Counter: suitable for the creation of statistics of an incremental value (e.g. energy consumption or production). It calculates the variation (delta) of the value for each time interval with respect to the previous one. Further, it is possible to specify time slots and the relative rates to calculate for instance the costs for energy consumption.
Let's assign a generic ID to this Datalogger, for example "d1"
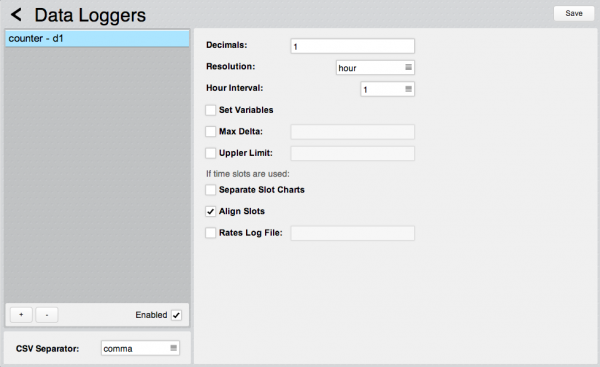
The default settings are ok for this example. Leave everything unchanged.
Press the button ![]() and wait for Hsyco restart.
and wait for Hsyco restart.
The Datalogger logic
Open the "Project Editor" and add a "button" object linked with datapoint "dummy.light.1" If you need further information about the Dummy I/O server please read this: Tutorial5
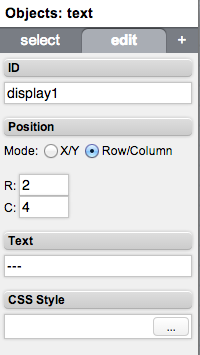
Then add a "text" object with this attributes:
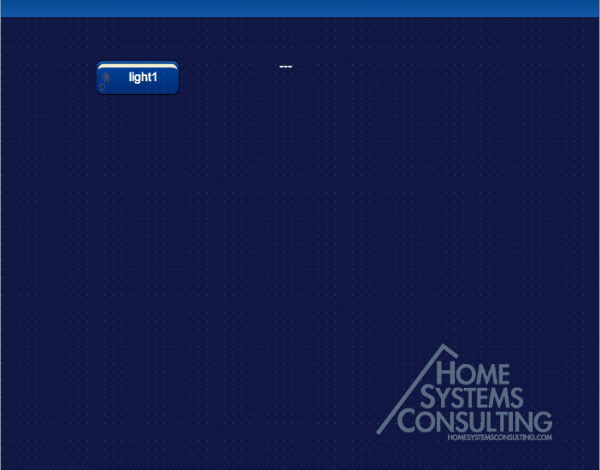
Here's the final result:


