Draw API
The Draw API allows to create graphics through various drawing instruction. These instructions are grouped together (separated as semicolons) and set as the value of the draw UI attribute of any image object. E.g. These instructions
fill('150,150,150');rectangle(10,10,100,100,red,green);line(10,10,110,110,black);
can be drawn for example from events:
uiset myimage.draw="fill('150,150,150');rectangle(10,10,100,100,red,green);line(10,10,110,110,black);"
In any of the functions, the coordinate of the top left pixel is 0,0.
Contents
Functions
Arc
arc(x, y, w, h, start, extent, type, border_color, fill_color)Draws an ellipse or a circle. Parameters:
- x: the x coordinate of the upper-left corner of the arc's framing rectangle
- y: the y coordinate of the upper-left corner of the arc's framing rectangle
- w: the overall width of the full ellipse of which this arc is a partial section
- h: the overall height of the full ellipse of which this arc is a partial section
- start: the starting angle of the arc in degrees
- extent: the angular extent of the arc in degrees
- type: the closure type for the arc: "open", "chord" or "pie"
- border_color: see the note below
- fill_color: see the note below
Ellipse
ellipse(x, y, w, h, border_color, fill_color)Draws an arc. Parameters:
- x: the x coordinate of the upper-left corner of the ellipse's framing rectangle
- y: the y coordinate of the upper-left corner of the ellipse's framing rectangle
- w: the overall width of the ellipse
- h: the overall height of the ellipse
- border_color: see the note below
- fill_color: see the note below
Fill
fill(color)Fills the whole area with given color. Parameters:
- color: see the note below
Image
image(file, x, y)Parameters:
- file: the full pathname, relative to the HSYCO home directory
- x: the x coordinate of the location where the String should be rendered - y: the y coordinate of the location where the String should be rendered
Line
line(x1, y1, x2, y2, ...., color)Draws a sequence of connected lines - x1: X axis coordinate of first point Parameters:
- y1: Y axis coordinate of first point
- x2: X axis coordinate of second point
- y2: Y axis coordinate of second point
- xN: X axis coordinate of N-th point
- yN: Y axis coordinate of N-th point
- color: see the note below
Spline
spline(x1, y1, x2, y2, ...., color)draws a natural cubic spline interpolation of a sequence of points - x1: X axis coordinate of first point Parameters:
- y1: Y axis coordinate of first point
- x2: X axis coordinate of second point
- y2: Y axis coordinate of second point
- xN: X axis coordinate of N-th point
- yN: Y axis coordinate of N-th point
- color: see the note below
Rectangle
rectangle(x, y, w, h, border_color, fill_color)Parameters:
- x: the x coordinate of the upper-left corner of the rectangle
- y: the y coordinate of the upper-left corner of the rectangle
- w: the width of the rectangle
- h: the height of the rectangle
- border_color: see the note below
- fill_color: see the note below
String
string(text, x, y, font, style, size, color)Parameters:
- text: quoted text
- x: the x coordinate of the location where the String should be rendered - y: the y coordinate of the location where the String should be rendered - font: font name, like “arial”, “helvetica”, “courier” etc.
- style: “bold”, “italic”, or “bolditalic”
- color: see the note below
Stroke
stroke(w)Set the stroke width for all subsequent drawing commands. Parameters:
- w: the width of the stroke
- an RGB comma separated numeric notation (delimited by quotes), with values from 0 to 255 (for example, "255,0,0" is red)
- an RGBA comma separated numeric notation (delimited by quotes), with values from 0 to 255 for R,G and B and from 0 to 100 for the alpha channel (for example, "255,0,0,50" is red with 50% alpha)
- color names. The valid names are: black, blue, cyan, darkgray, gray, lightgray, green, magenta, orange, pink, red, white, yellow, transparent.
Examples
Draw a pie chart
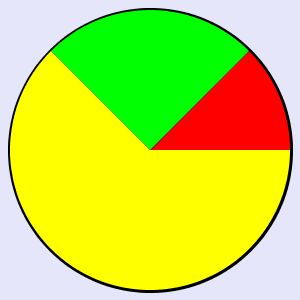
In this example we are going to draw a pie chart with three slices of 45°, 90° and 225°. Keep in mind that for the arc function, 0° is the the rightmost point of the circle, and that from the starting point arcs are drawn in an anti-clockwise direction.
Let's describe the instructions we're going to use:
- fill('230,230,250') - Fill the background with the specified color
- stroke(5) - Set the line width for the pie's border to 5 pixels
- arc(10,10,280,280,0,360,pie,black,yellow); - draw a background yellow circle
- stroke(0) - Draw no border on the slices
- arc(10,10,280,280,0,45,pie,black,red) - draw the first slice from 0° to 45° in red
- arc(10,10,280,280,45,90,pie,black,green); - draw the second slice from 45° to 135° in green
There's no need to draw the third slice, since we already have a yellow background circle.
The line of code in java or javascript:
uiSet("myimage","draw","fill('230,230,250');stroke(5);arc(10,10,280,280,0,360,pie,black,yellow);
stroke(0);arc(10,10,280,280,0,45,pie,black,red);arc(10,10,280,280,45,90,pie,black,green);")