Data Loggers
Jump to navigation
Jump to search
Data loggers allow to gather, process and visualize statistical data on the variations of a data set.
They can be used to automatically generate periodic charts of its trend and/or to log data as CSV files.
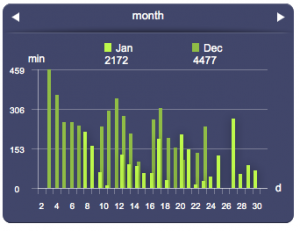
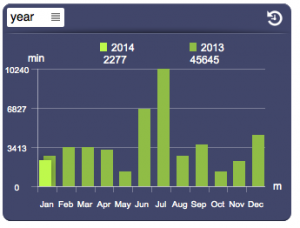
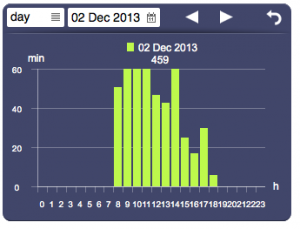
Data loggers collect data and group them in order to visualize the trends for each hour (or group of hours) of the current and past day, each day of the current and past month, and each month of the current and past year.
Further, they allows for the logging of every processed value.
There are two types of data logger:
- counter: suitable for the creation of statistics of an incremental value (e.g. energy consumption or production). It calculates the variation (delta) of the value for each time interval with respect to the previous one. Further, it is possible to specify time slots and the relative rates to calculate for instance the costs for energy consumption.
- range: aimed at the computation of the maximum, minimum, and average of a fluctuating value (e.g. a measured temperature or humidity) for each time interval.
Once a data logger is defined in hsyco.ini, you can easily pass data to it using a simple action in EVENTS, a JavaScript function or Java method, and display statistical data using the (datalogger) graphic object.


