Datalogger
Jump to navigation
Jump to search
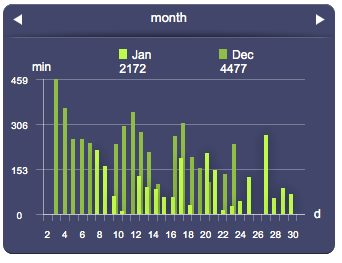
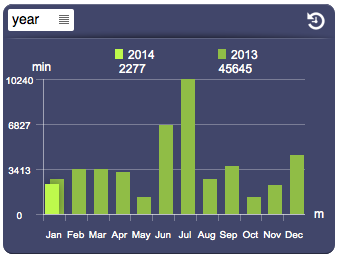
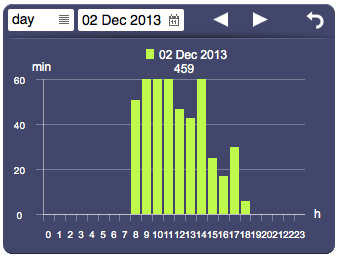
Works in combination with the data logger function to present a collection of data using time-based statistical charts. This object automatically adapts the graphical layout and size of the charts based on the overall object's size. The default presentation can be customized using several optional attributes. A datalogger can have a browser mode (if available server-side) for consulting past data. If a datalogger in browser mode isn't visible for more than a minute, it automatically resets to live mode.
Parameters
- id: the object's ID, used by UISets. Required
- loggerID: the datalogger ID
- position: the object's position. Use the pixels or rows and columns coordinates format
- size: the chart's area's width and height
- label: the values axis label
- attributes: list of UI attribute ids and values defining the chart's aspect and data. Setting this parameter is the same as setting each UI attribute with a UISet
Syntax
(datalogger[!<id>] <loggerID>; <pos>; <width>; <height>; <label>; <attributes>)
E.g.
(datalogger!datalogger1 edl; x80y60; 820; 500; kWh; controls=toolbar)
UI Attributes
Common attributes
| Name | Value | Description |
|---|---|---|
| pos | x<x>y<y> | Position specified as x/y coordinates. E.g. x-5y10 |
| visible | true | Default. Show the object |
| false | Hide the object | |
| blink | true | slow | Blink the object at a slow speed |
| fast | Blink the object at a fast speed | |
| false | Stop the blinking | |
| opacity | 0.0 ... 1.0 | Object opacity from 0 (not visible) to 1 (fully visible) |
| rotation | 0 ... 360 | Object rotation in degrees. Images are rotated around the center point, all other objects are rotated around the top left corner |
Datalogger attributes
| Name | Value | Description |
|---|---|---|
| type | bars | Draw bars |
| gauge | Draw a gauge, for charts with a single value. Use with the "value" attribute | |
| points | Draws points | |
| line | Draws a line connecting the values | |
| spline | Draws a spline connecting the values | |
| mode | live | Live mode |
| browser | Browser mode | |
| slot | <number> | Show a specific slot, from 0 to the number of slots-1 |
| scale | year | Set the live scale to year |
| month | Set the live scale to month | |
| day | Set the live scale to day | |
| hour | Set the live scale to hour | |
| browserscale | year | Set the browser scale to year |
| month | Set the browser scale to month | |
| day | Set the browser scale to day | |
| hour | Set the browser scale to hour | |
| browserdate | date and time, in the "yyyymmddhh" format | Set the browser date and time. These formats will also be accepted: "yyyy", "yyyymm", "yyyymmdd" |
| controls | tabs | Show tabs on live mode for scale and slots |
| toolbar | Show a toolbar to control live and browser modes | |
| none | Don't show any controls | |
| panel | true | Show background panel |
| false | Hide background panel | |
| multichart | true | Show multiple charts on live mode |
| false | Show a single chart on live mode, based on the selected scale | |
| pastperiod | true | Show past period |
| false | Hide past period | |
| bymonth | true | Show monthly data (days) |
| false | Hide monthly data | |
| byday | true | Show daily data (hours) |
| false | Hide daily data | |
| byhour | true | Show hourly data (minutes) |
| false | Hide hourly data | |
| byminute | true | Show data by minute (seconds) |
| false | Hide data by minute | |
| minvalues | true | Show minimum values, if in range mode |
| false | Hide minimum values | |
| avgvalues | true | Show average values, if in range mode |
| false | Hide average values | |
| maxvalues | true | Show maximum values, if in range mode |
| false | Hide maximum values | |
| totals | true | Show totals |
| false | Hide totals | |
| legend | true | Show all legends |
| false | Hide legends | |
| <comma-separated list of values> | List of legends (min, avg, max) to show | |
| presentvaluecolor | <CSS color> | A color that applies to all present values |
| <CSS color>,<CSS color>,<CSS color> | Colors that apply respectively to minimum, average and maximum present values | |
| pastvaluecolor | <CSS color> | A color that applies to all past values |
| <CSS color>,<CSS color>,<CSS color> | Colors that apply respectively to minimum, average and maximum past values | |
| valuelabelcolor | <CSS color> | Value label's color |
| valuelabeltype | inside | Value labels are shown inside (if "type" is bars, points or gauge) or over (if "type" is line or spline) |
| outside | Value labels are shown above or below | |
| popup | Value labels are shown on mouseover, or on touch (if on a touch-enabled device) | |
| group | <value> | Name of a group. Dataloggers with the same group are synchronized (controlling one affects the others) |
| notches | <value> | Number of notches on the x-axis (for vertical charts) or on the y-axis (for horizontal charts) |
| axiscolor | <CSS color> | Axis color |
| drawaxis | true | Default. The axes are visible (also notches and labels) |
| false | The axes are not visible (also notches and labels) | |
| notchcolor | <CSS color> | Color of the axis notches |
| labelcolor | <CSS color> | Color of the axis and bars labels |
| pointsize | number of pixels | Point size (use for the points chart type) |
| stroke | number of pixel | Pixel size of the stroke that applies to line and spline chart's types |
| thresholds | <comma-separated list of values> | List of values at which to display a line (threshold) |
| thresholdcolor | <CSS color> | Color of threshold lines |
| thresholdcolors | <comma-separated list of CSS colors> | List of colors of threshold lines, one value each line |
A CSS color can be specified as
- hex value: #<rr><gg><bb> E.g. #FF1010
- color name: red, blue, white...
- as rgb: rgb(<r>,<g>,<b>) E.g. rgb(255,30,30)
- as rgba: rgba(<r>,<g>,<b>,<alpha>) E.g. rgba(255,30,30,0.5)


