Difference between revisions of "Status Browser"
| Line 4: | Line 4: | ||
| − | [[File:Manager_status_browser_data_points.png|border|center]] | + | [[File:Manager_status_browser_data_points.png|border|center|600px]] |
| Line 12: | Line 12: | ||
| − | [[File:Manager_status_browser_ui_attributes.png|border|center]] | + | [[File:Manager_status_browser_ui_attributes.png|border|center|600px]] |
| Line 20: | Line 20: | ||
| − | [[File:Manager_status_browser_variables.png|border|center]] | + | [[File:Manager_status_browser_variables.png|border|center|600px]] |
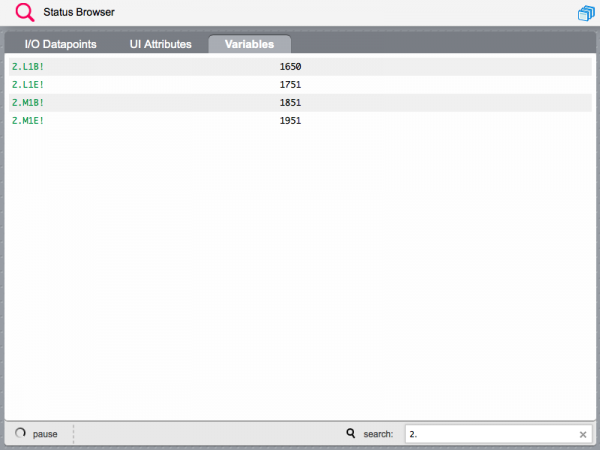
The variables tab shows the values of all volatile and persistent variables. | The variables tab shows the values of all volatile and persistent variables. | ||
Revision as of 22:54, 26 February 2014
The Status Browser, in the Manager toolkit, allows you to show the real time status of data points, user interface attributes and variables.
Open the Manager at https://192.168.0.50/hsycoserver/manager and press the Status Browser icon.
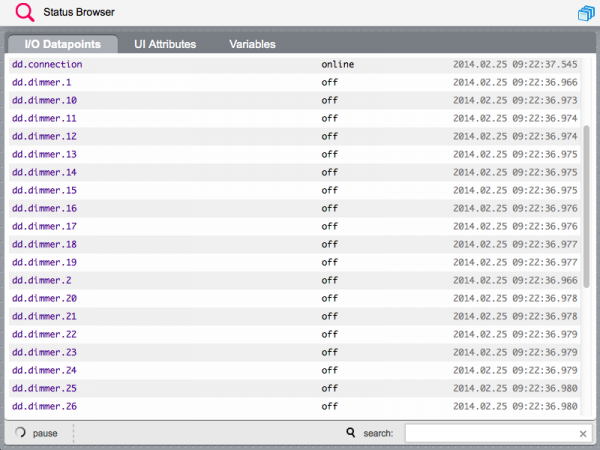
The data point tab shows the real time values of all I/O data points, and the time stamp of each data point last change.
You can pause the real time update, and filter the list by data point name.
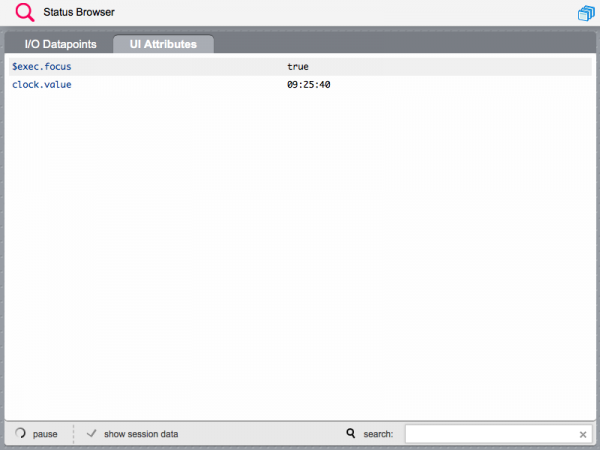
The UI attributes tab shows all user interface ids and attributes with values that have been set with the UISET or uiSet() methods.
In order to view session specific attributes, you should open a tab or window on the same browser where you are using the Manager, and then select the show session data checkbox in the Status Browser. This will show both global and session data for that tab.
The variables tab shows the values of all volatile and persistent variables.


